| Examine the shape of the short-run cost curves.
|
| In economics the short-run is the period of time when at least one factor of production is fixed. In production these factors could either be the land (raw materials used in the production of a goods), capital (the producers means of production - machinery), or labour (the employees who put in effort).
|
| In the short-run there are only two categories of cost, the fixed costs and the variable costs. Both of these categories can be subdivided into total costs and average costs.
|
| Fixed costs are the easiest to deal with, as they are those that do not vary with output, so even if output was at zero, they would still have to be paid. They could include interest repayments, rental charges, security, insurance, research etc.
|
|
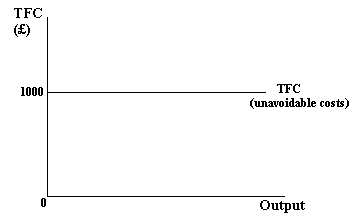
| As you can see, the graph is a straight line and will continue being a straight line because TFC does not change (fixed at £1000).
|
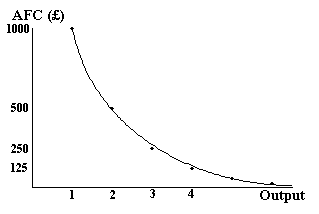
| Average fixed costs show the fixed costs per unit output. As fixed costs by definition stay the same, AFC's will diminish as output increases. This explains the shape of the AFC curve (given by the formula AFC = TFC / Q ), which is called a rectangular hyperbola. Points A and B show how AFC falls dramatically at first, before tailing off.
|
|
| Variable costs are therefore those costs that do vary with output (also known as avoidable or direct costs).
|

|
| The shape of the TVC curve is the result of the law of diminishing returns. At first each extra unit of cost secures more additional output than the previous unit (increasing returns). This continues until the point of inflection (where the last unit secured the same output as the one before), after which a firm will experience diminishing returns. Eventually, when output is at a maximum, no amount of additional cost will secure additional output. When this happens the TVC curve will become vertical and may even begin to bend back on itself.
|
| As they are both victims of the law of diminishing marginal returns, you would expect the total product (TP) curve to be similar in behaviour to the TVC curve. Infact, the TP curve is an inversion of the TVC curve:
|

|
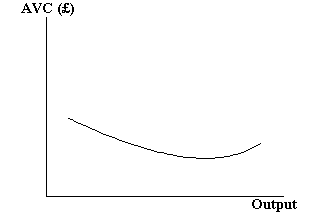
| Average variable costs show the variable costs per unit output, and are therefore also related to the law of diminishing returns and to the TVC curve.
|
|
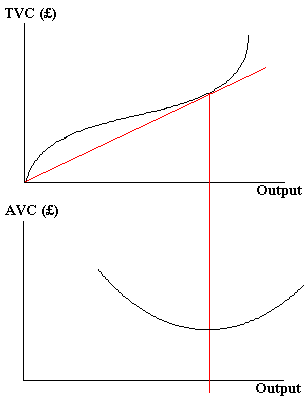
| Infact, a line drawn from the origin, with the smallest possible gradient, at a tangent to the TVC curve, corresponds to the minimum value on the AVC curve:
|
|
| The AVC curve is u-shaped (at first declining and then rising) and when AVC is at a minimum, then the firm is producing the most it can per pound spent on costs. This is called the 'optimum output' point.
|
| Total costs (TC) are, as you would expect, a total of all the costs. The costs involved in the short-run are the fixed costs and the variable costs, and so these added together give the total costs (TC = TVC + TFC). The curve doesn't pass through the origin, because of the fixed costs that effectively shift the VC curve up by the value of the FC. As the FC's are obviously constant throughout, the curve is the same shape as the TVC curve. The TC curve is called a composite curve, as it is the sum of two other curves.
|
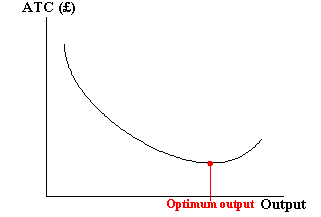
| There is also an ATC curve to go along with the TC:
|
|
| Again there is a connection between a tangent with the lowest gradient to the TC curve, which corresponds to the minimum value on the ATC curve. This point on the ATC curve is the optimum output where a good is produced at the lowest possible cost per unit, which means productive efficiency. You can then change output by increasing variable inputs.
|
| Toby Pearce (Sept. 1997)
|


